5 bättre KPI:er att hålla koll på efter makeover av sajten

Nya sajten är lanserad. Trafiken håller fortfarande efter en vecka och inga dramatiska ändringar i exit rate. Konvertering ser ut att vara relativt stabil. All good? Här kommer 5 andra KPI:er som jag kommer titta på efter lansering av vår nya e-handelssajt för att vara säker.

Konverteringsgrad per device

Är det lättare eller svårare att köpa för användare som kör en smartphone och har vår mobilstrategi gjort upplevelsen fattig på desktop?

Andel trafik från SEO

Efter ett par veckor bör vi kunna se om Google straffar eller hyllar vår nya sajt genom att se vilken mängd trafik som kommer in. Om det är lägre får vi titta på om det är produktsidor, kategorier eller något annat som spökar.

Genomsnitt antal produkter per order

Vi vill ju att kunderna ska köpa mer inte mindre. Att få med flera produkter i en order kan göra hela skillnaden för att bära fraktkostnaden.

Andel kundkorg till betalning

Hur många lägger en vara i kundvagnen för att sedan ansluta sitt köp? Vi har väl inte gjort det svårt att hitta till kassan eller förvirrande att betala?

Andel tillbehörsförsäljning

Hur stor andel av totala antalet produkter som säljs är tillbehör? Är vi bättre eller sämre på upsell än förut?

###

Denna post är nummer 16 i en serie av 100 poster i utmaningen #blogg100 där jag fokuserar på hur vi skapar Trettis nya sajt. Alla åsikter är mina egna.
3 key reasons to why User retention is your most important metric

Cohort-Created-To-Signup-Problem_thumb

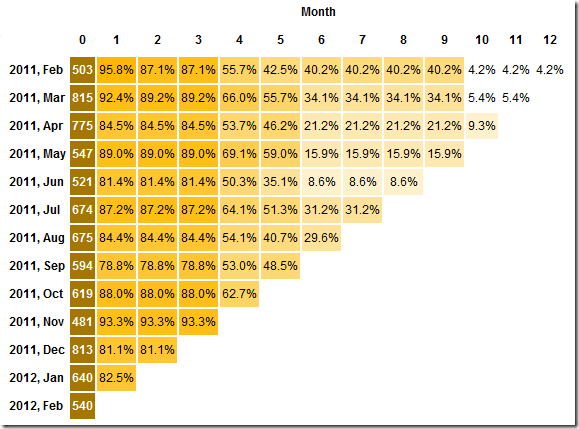
What’s Your most important Key Performance Indicator (KPI)? New users? Sales per day? Website visitors? I would argue that they are all secondary to User Retention, i.e. retaining users and make to come back after one day, one week and one month. Here’s why:

  1. User retention is the most accurate metrics to show that people like your product or service. As Nir Eyal puts it in his great book “Hooked”; You want to help your users develop a habit of using your product.  The higher retention you have in the long run, the happier your users are and the more likely they are to recommend your product to a friend.
  2. Forget about new users for a second. It’s nice to see growth, but it’s worthless without people coming back. If less than 30% of your users are coming back one week after signing up or less than 20% of them are coming back after one month, then stop spending money on marketing and social media posts. Your funnel is leaking and you need to fix it. These numbers are of course different if you are selling cars on a website, then if you are trying to get people on board a new social network, but it’s a good ballpark figure.
  3. Sales and user retention are closely correlated. The more people are getting involved with your brand and your product, the more likely they are to buy something. If you constantly get them to come back to experience something new, reward them for their progress and create a habit, your sales will come.

So how do you do it? Make sure to set up proper cohort analysis of daily new users and track their 2nd day, 2nd week and 2nd month retention. How you define retention is up to you. In it’s basic form it’s just people coming back and opening an app or visiting a webpage. You could also tie it to some key product actions like logins or posting some user generated content.

Google Analytics can’t do cohort analysis (as far as I know), so I recommend you use a service like Mixpanel or Localytics.